The Abbotsford Police Department (APD) this week released stats dispelling the myth that the drivers of red cars are picked on by officers handing out tickets.
The figures compare the percentage of each colour of car on the road versus the percentage of tickets issued to those drivers.
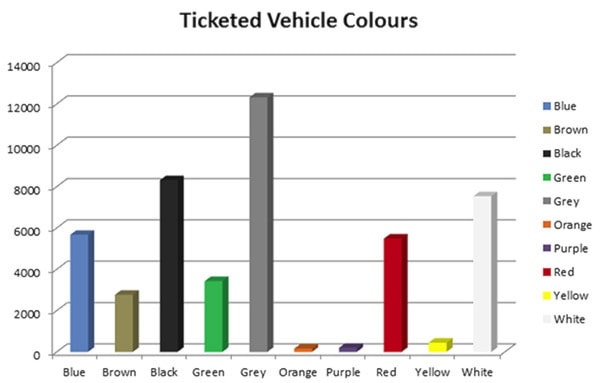
Black and green cars topped the list, with a slightly higher percentage of drivers cited for road infractions compared to the number of those vehicles on the road.
The stats cover the period from mid-2010 to the end of 2013. During that period, 46,316 tickets were given to the drivers of 10 different coloured vehicles.
Black cars accounted for 15.6 per cent of the vehicles on the road in Abbotsford, with their drivers collecting 17.9 per cent of the tickets.
The figures for green vehicles were 6.3 and 7.4 per cent respectively.
The stats for red cars were almost even, with 11.6 per cent of that colour on the road compared to 11.8 of those drivers being fined.
The figures for brown, white and grey/silver vehicles went the other way, with a slightly lower percentage of those drivers being ticketed compared to the percentage of those cars.
The biggest difference was with grey/silver vehicles, which accounted for 31.3 per cent of the cars on the road, with 26.6 per cent of those drivers being issued tickets.
Last week, the APD released stats comparing 31 makes of cars and the number of tickets handed out to their drivers.