A new demographics project will aid people thinking about moving to, or starting a business in Abbotsford.
The city is producing a series of pamphlets, based on Canada Census information, which breaks down information into smaller geographic locations.
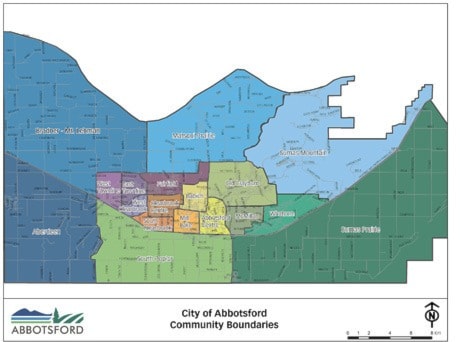
Normally, census information released to the public is city-wide.
The new initiative divides the city into 18 geographic sections, consistent with Census Canada boundaries, and includes 12 urban and six rural areas. All information is based on the 2006 census results as the recent 2011 census results will not be made available until 2013.
At that time the profiles will be updated.
Amy Anaka, a planner with the city, told council that numerous requests are received every year for more detailed demographic information. Request come from businesses, community agencies, developers and the general public. She also said city staff uses the information for planning and economic development initiatives.
The 18 pamphlets are not completed yet. The 12 urban areas should be complete by the end of the year, while the six rural area should be done by the fall of 2012. However the city overview and Mill Lake area information have been completed and show how certain sectors can differ from the city norm.
For example, the gender make up of the City of Abbotsford is 50.7 per cent female and 49.3 per cent male. But in the Mill Lake area, it is 55.9 per cent female and 44.1 per cent male.
Another example would be the differences in age groups. On average, 4.2 per cent of Abbotsford's population is over 80 years old and 12.9 per cent is under 10. But in the Mill Lake area, 15.4 per cent of the population is over 80 while just 9.5 per cent is under 10.
"Remind me not to open a skateboard shop around Mill Lake," joked Abbotsford Mayor George Peary.
On a more serious note, Peary said the information will be invaluable to new businesses researching where to locate its company.
"Normally you don't get this kind of detailed information unless you hunt for it," said Jay Teichroeb, general manager of economic development and planning services.
He said a quick look at the data tells him that a lot of widows likely live in the Mill Lake area. The dramatic discrepancy of men vs. women and the age differences hint at it.
Once complete, the pamphlets will be made available to the public for pick up or on the city website.
The projects was completed using existing staff resources and required no extra funding.
Comparisons:
- According to the 2006 Census, 24.3 per cent of Abbotsford residents earned between $10,000 and $19,000, while in the Mill Lake area the number rises to 31.4 per cent.
- In Abbotsford, 32.5 per cent of the population (over the age of 15) is not in the labour force while in the Mill Lake area the number rises to 44.3 per cent.
- In Abbotsford, 78.8 per cent of the population's home language is English. That number rises to 87.8 per cent in Mill Lake area.
- The average Abbotsford household consists of 2.8 people, the average Mill Lake household is 2.1.